
Yes, you can have insulin resistance at a normal weight with a normal A1c. In a national study of 6,247 adults aged 18 to 44 without diabetes, 4 in 10 had insulin resistance, and close to half of those were not obese. Fishtown Medicine measures fasting insulin alongside glucose, because insulin climbs years before blood sugar changes.
TL;DR: Insulin is the hormone that moves sugar out of your blood and into your cells. When your cells stop answering it well, that is insulin resistance, and it can build for years before your blood sugar looks wrong. A national study of 6,247 adults aged 18 to 44, none of them diabetic, found that about 4 in 10 had insulin resistance. Close to half of those people were not obese. A regular checkup often misses this, because the 2 tests it leans on change late, and because the screening rules start at age 35 and only apply if your BMI is 25 or higher. To find out where you stand, ask for a fasting insulin level with your next bloodwork, and bring the result to a doctor who will read it next to how you feel and what else is on the panel.
Everyone in this study had blood sugar in the normal range. That was the entry requirement. Researchers took 6,247 adults between 18 and 44 from a national health survey, removed anyone with diabetes or known heart disease, and measured what was left. About 4 in 10 of them had insulin resistance.
If your bloodwork came back fine and you are young enough that nobody suggested looking further, that number is the argument for looking anyway. The tests in a standard checkup are built to catch this problem once it has arrived. Insulin resistance arrives years earlier, and it can be measured the whole time it is building.
What did the study find?
About 4 in 10 young adults without diabetes had insulin resistance, and the number barely moved across 12 years.
The work comes from the National Health and Nutrition Examination Survey, the long-running federal program that examines a representative slice of the country in mobile clinics. Researchers pooled 6 survey cycles from 2007 through 2018 and looked at adults 18 to 44 who had no diabetes and no known cardiovascular disease. Insulin resistance was 44.8% in the 2007 to 2010 group and 40.3% in the 2015 to 2018 group, a decline too small to call a trend. Among men it did fall, from 50.2% to 41.0%. Among women it held steady near 39.5%.
The measure they used is called HOMA-IR, which stands for homeostatic model assessment of insulin resistance. It is arithmetic performed on 2 fasting numbers, your glucose and your insulin, and it estimates how hard your pancreas is working to hold your blood sugar where it is. This study counted a HOMA-IR of 2.5 or higher as insulin resistance. That threshold is the study's own research definition, built for sorting a population. What an individual number means depends on the person it came from.
Can you have insulin resistance at a normal weight?
Yes. Roughly 1 in 4 normal-weight American adults (BMI 18.5 to 24.9) are metabolically unhealthy, and close to half of the young adults with insulin resistance in the national NHANES study were not obese.
Doctors call this pattern MONW (metabolically obese normal weight), or "thin on the outside, fat on the inside." In the NHANES study, people with insulin resistance were more likely to have a BMI of 30 or above (56.6% versus 14.7%), so body size still matters. Yet when researchers compared insulin resistance against whole-body DEXA scans, total BMI and regional fat each explained only a fifth to a quarter of the person-to-person difference.
Why can two people stand at the same height and weight, with a BMI of 22, while one has clear arteries and the other has fatty liver and prediabetes? The answer comes down to two physiological rules: your personal fat threshold and adipose tissue expandability.
Your Personal Fat Threshold and the ReTUNE Trial
Think of subcutaneous fat - the pinchable fat under the skin of your hips, thighs, and buttocks - as a safe storage tank. Large genetic studies (Lotta et al., Nature Genetics 2017) show that dozens of gene variants control how easily you can recruit new, small fat cells in your lower body when you eat extra calories.
If you inherited a large safe storage tank, you can gain 40 or 50 pounds and reach a BMI of 34 while keeping almost all of that energy safely tucked under the skin. If you inherited a small safe tank, your hip and thigh fat cells fill up at a BMI of 21 or 22. Once that safe tank hits its ceiling, swollen fat cells become inflamed, drop their protective hormone (adiponectin), and spill free fatty acids into the bloodstream. That spillover settles inside your abdomen (visceral fat), your liver, and your pancreas.
Inside liver cells, those spilled fats form molecules called diacylglycerols (DAG) and ceramides. As Gerald Shulman showed in The New England Journal of Medicine, DAG activates an enzyme (PKC-epsilon) that gums up the liver's insulin receptor. Even when your pancreas floods the bloodstream with insulin, the liver cannot hear the signal, so it keeps pouring extra sugar into your blood all night.
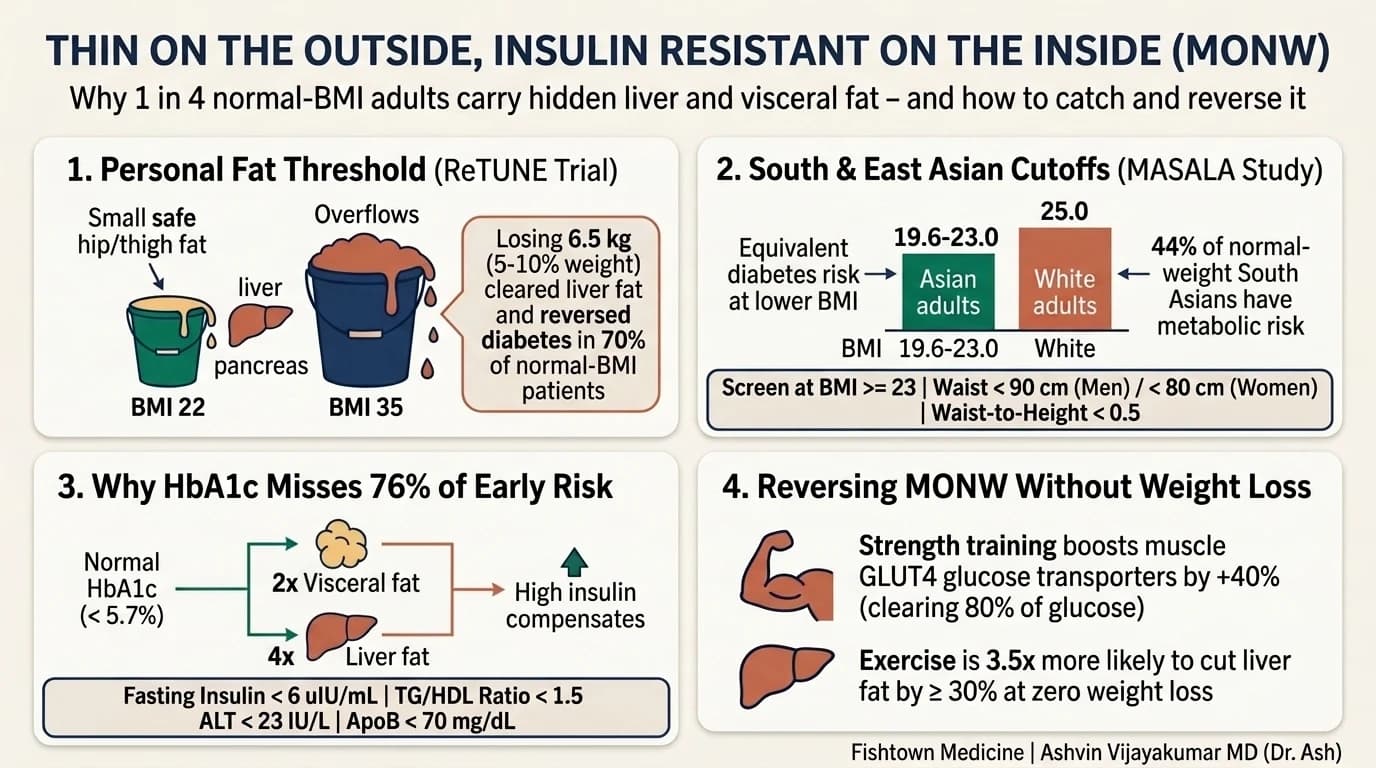
Roy Taylor proved this in the ReTUNE trial (Clinical Science 2023). He enrolled adults who developed type 2 diabetes despite having a normal or near-normal BMI (21 to 27 kg/m²). MRI scans showed their liver fat was 3 times higher than normal even though they looked lean in clothes. When they lost just 6.5 kg (about 5% to 10% of their body weight, shifting average BMI from 24.8 down to 22.5), liver and pancreas fat cleared out and 70% put their diabetes into full remission. They were never "too heavy" by a textbook chart. They had simply crossed their personal fat threshold.
Why do standard BMI charts fail South Asian and East Asian adults?
Standard BMI cutoffs were built on European-descent populations and miss more than a third of metabolic disease in Asian adults.
At the same body-fat percentage, South Asian and East Asian adults carry a BMI roughly 2 to 3 points lower than White adults. In a landmark diabetes screening study (Araneta et al., Diabetes Care 2015), waiting until a BMI of 25 missed 36% of undiagnosed diabetes in Asian Americans (sensitivity 63.7%). Lowering the screening trigger to BMI 23 caught 84.7% of cases, which is why the American Diabetes Association, the World Health Organization, and the US Preventive Services Task Force now set BMI 23.0 as the overweight cutoff for Asian adults.
In the MASALA study of South Asian Americans and national NHANES analyses (Aggarwal et al., Annals of Internal Medicine 2022), the gap is even sharper:
- Equivalent diabetes risk at BMI 19.6 to 20.0: A South Asian adult at a BMI of 19.6 carries the same diabetes prevalence as a White adult at a BMI of 25.0.
- 44% abnormal at normal weight: Nearly 44% of normal-weight South Asians have metabolic dysfunction, compared with 21% of normal-weight White adults.
- More liver and muscle fat at lower weight: CT body-composition scans (Shah et al., International Journal of Obesity 2016) show that South Asians carry significantly more liver fat, more fat marbled inside muscle, and less total skeletal muscle than White, Black, Latino, or Chinese American adults despite a lower BMI.
Because scale weight hides abdominal fat, we pair ethnic-specific BMI with two tape-measure checks you can run at home:
- Waist-to-Height Ratio under 0.5: Your waist circumference (measured at the belly button) should be less than half your height, regardless of race or sex.
- Ethnic-specific waist ceilings: For South Asian and East Asian adults, metabolic risk climbs above 90 cm (35.4 inches) in men and 80 cm (31.5 inches) in women, compared with 102 cm (40 in) and 88 cm (35 in) in European-descent charts. Read our full South Asian Cardiometabolic Playbook for the complete family-risk workup.
Why does a regular checkup miss this?
Because hemoglobin A1c and fasting glucose only turn abnormal after years of pancreatic overtime, missing roughly 3 out of 4 insulin-resistant adults.
In a gold-standard insulin clamp study of lean Asian adults with a BMI of 22 (Ding et al., AJP Endocrinology and Metabolism 2018), insulin-resistant participants had 2 times more visceral fat, 4 times more liver fat, 20% to 30% worse muscle glucose clearance, and 65% higher post-meal insulin levels than healthy peers of the same BMI. Yet their fasting blood glucose and hemoglobin A1c were identical.
In the multicenter IRAS cohort (Lorenzo et al., Diabetes Care 2010), using prediabetes A1c cutoffs (5.7% to 6.4%) caught only 23.6% of clamp-proven insulin-resistant adults - missing 76.4% of people whose pancreas was still working overtime to keep blood sugar down.
Dr. Ash puts it to patients this way on calls: A1c is a fine test if you already have diabetes. If you do not, you want an insulin level, because you want to know before that problem happens.
Guidance from the Clinic

What should you check, and what do the numbers mean?
Instead of relying on A1c alone, a five-marker panel exposes hidden visceral and liver fat years before blood sugar rises.
| Marker | Standard Lab "Normal" | Fishtown Preventive Target | Why It Catches Lean Insulin Resistance |
|---|---|---|---|
| Fasting Insulin | < 18 to 25 uIU/mL | 3 to 6 uIU/mL (> 9 is high; HOMA-IR < 1.5) | Measures pancreatic effort directly. Values of 1 to 2 can signal underfueling in heavy trainers; 10 to 15 is hidden compensation. |
| Triglyceride-to-HDL Ratio | Not reported | Under 1.5 (Under 2.0 max) | Best insulin-free blood clue. In normal-weight adults, a TG/HDL ratio of 3.0 or higher triples the odds of insulin resistance (Pantoja-Torres 2019). |
| ALT (Liver Enzyme) | < 40 to 50 IU/L | Under 23 IU/L | Up to 60% of fatty liver hides inside lab "normal." On 3T MRI liver scans (Martin-Rodriguez 2017), an ALT above 23 IU/L identifies early liver fat with 93% accuracy. |
| ApoB | < 100 to 130 mg/dL | Under 70 mg/dL (< 60 if high risk) | Counts every plaque-forming particle. Insulin resistance packs cholesterol into small, dense particles that standard LDL misses (Sierra-Johnson 2007). |
| DEXA Visceral Fat & ALMI | Not ordered | VAT < 100 cm² (< 1.0 lb)** + **ALMI > 50th percentile | Measures abdominal visceral fat and arm/leg muscle mass directly so you know whether you need more muscle, less visceral fat, or both. |
The full reasoning behind our blood targets lives on metabolic health beyond A1c. When fasting insulin or the TG/HDL ratio comes back high, a continuous glucose monitor for 2 weeks shows how your glucose behaves around your own meals, workouts, and sleep. You can also see how we read reference ranges in how to read your lab results and the tests most annual panels leave out.
How do you reverse normal-weight insulin resistance without starving yourself?
By expanding your skeletal muscle glucose sink with strength training and draining liver and visceral fat - neither of which requires losing scale weight if you are already lean.
To be direct about the evidence boundary: no 10,000-person randomized trial has enrolled only lean insulin-resistant adults for a multi-year exercise outcome study. What we do have are mechanism trials, MRI liver studies, and smaller body-recomposition trials that show why chasing a lower number on the bathroom scale is the wrong goal when your BMI is already 21 or 22:
- Build the muscle glucose sink (strength training 2 to 4 days/week): Skeletal muscle clears roughly 80% of insulin-stimulated blood sugar. In a classic randomized trial (Holten et al., Diabetes 2004), adults trained only one leg for 6 weeks while leaving the other leg untrained. Whole-body weight stayed the same, yet the trained leg increased its GLUT4 glucose transporters by 40%, boosted insulin signaling proteins, and cleared significantly more blood sugar than the untrained leg in the same body. In a 10-week resistance circuit study of normal-weight-obese women, strength training alone moved 50% of participants out of the metabolically unhealthy category without dieting. Because the acute glucose boost from a workout fades after 48 to 72 hours, spacing sessions across the week matters more than marathon weekend workouts.
- Drain liver and visceral fat at zero weight loss: You do not have to lose pounds on the scale to empty fat out of your liver and abdomen. In Robert Ross's landmark Annals of Internal Medicine trial, men who exercised daily while eating back 100% of their burned calories (zero scale weight loss) still significantly shrank their MRI-measured visceral fat. Even better, a 2023 meta-analysis of MRI liver trials by Stine et al. proved that exercise training makes adults 3.5 times more likely to cut liver fat by 30% or more even without weight loss.
- Use a modest 5% trim only if you crossed your personal fat threshold: If your BMI moved from 20 in college to 24.5 in your late 30s and your waist grew 2 inches, a gentle 5% weight reduction (8 to 12 pounds) while lifting weights and eating 1.6 g/kg of protein is remarkably potent. In a study of lean metabolically unhealthy adults (Chooi et al., Obesity 2018), a 5% weight trim cut liver fat in half (by 50%), trimmed visceral fat by 11%, and improved clamp-measured insulin sensitivity by 21% to 26%.
That sequence - muscle first, sleep and stress second, protein and starch timing third, and targeted medication only when needed - is laid out in the metabolic health pillar and metabolic flexibility.
When should you get this checked sooner?
Use these If -> Then rules to decide whether to run the full panel now:
- If you are of South Asian, East Asian, Filipino, or Latino heritage and your BMI is 23 or higher (or your waist-to-height ratio is 0.5 or above) -> Then order fasting insulin, HbA1c, lipid panel (TG/HDL), ApoB, Lp(a), and ALT now instead of waiting for age 35 or BMI 25.
- If your A1c is "normal" (under 5.7%) but your TG/HDL ratio is above 2.0 or your ALT is above 23 IU/L -> Then add a fasting insulin draw and consider a DEXA body composition scan to check visceral fat and muscle mass.
- If you have PCOS, a history of gestational diabetes, or a parent with type 2 diabetes or early heart disease -> Then check fasting insulin and ApoB in your 20s or 30s regardless of how lean you look.
- If an earlier panel already put you in the prediabetes range -> Then read reversing prediabetes for our step-by-step protocol.
Separately, some symptoms need care now instead of a scheduled workup. Excessive thirst with frequent urination, unexplained weight loss, blurred vision, or persistent nausea and vomiting can signal blood sugar that is already high, and those belong in a same-day visit or an emergency department. Chest pain, shortness of breath at rest, or one-sided weakness are emergencies regardless of what any lab said last month.
Key Takeaways
- Roughly 1 in 4 normal-weight adults (BMI 18.5 to 24.9) are metabolically unhealthy (MONW), and in a national NHANES study of 6,247 young adults without diabetes, 4 in 10 had insulin resistance.
- Your personal fat threshold sets how much fat your hip and thigh skin can safely hold before energy spills into your liver and pancreas; in the ReTUNE trial, losing just 6.5 kg cleared liver fat and reversed diabetes in 70% of normal-BMI patients.
- Standard BMI cutoffs miss 36% of undiagnosed diabetes in Asian Americans; screening should start at BMI 23 (with equivalent diabetes risk appearing at BMI 19.6 to 20.0 in South Asians) alongside a waist-to-height ratio under 0.5.
- Hemoglobin A1c alone misses 76% of early insulin resistance; a 5-marker check (fasting insulin 3 to 6 uIU/mL, TG/HDL ratio under 1.5, ALT under 23 IU/L, ApoB under 70 mg/dL, and DEXA visceral fat) catches it years earlier.
- You do not need to lose scale weight to reverse lean insulin resistance: strength training boosts muscle GLUT4 glucose transporters by 40%, and exercise is 3.5 times more likely to cut liver fat by 30% or more even at zero weight loss.
Related at Fishtown Medicine
- 9-System Biomarker Reference Guide: Optimal vs Standard Lab Ranges - lookup table for fasting insulin, HOMA-IR, TG/HDL, ALT, ApoB, and every core marker
- Health for South Asians: Cardiometabolic Playbook - why standard BMI lies, MASALA study data, and the full family-risk workup
- Metabolic Health Beyond A1c - the tests we track instead of blood sugar alone, and the targets we use
- Understanding Insulin Resistance - what it is, what drives it, and how it gets treated
- The Tests Most Annual Panels Leave Out - the markers that move a prevention plan
- What Your Lab Results Mean - reference ranges, flags, and what a normal result can and cannot say
- Continuous Glucose Monitoring in Philadelphia - what 2 weeks of your own data shows
- The Metabolic Health Pillar - the whole framework this page is one way into
- CGMs and Glucose Optimization - reading your own glucose patterns
Scientific References
- Parcha V, Heindl B, Kalra R, Li P, Gower B, Arora G, Arora P. "Insulin Resistance and Cardiometabolic Risk Profile Among Nondiabetic American Young Adults: Insights From NHANES." The Journal of Clinical Endocrinology and Metabolism. 2022;107(1):e25-e37. Journal
- Taylor R, Barnes AC, Hollingsworth KG, et al. "Aetiology of Type 2 diabetes in people with a 'normal' body mass index: testing the personal fat threshold hypothesis (ReTUNE)." Clinical Science. 2023;137(16):1333-1346. PubMed
- Lotta LA, Gulati P, Day FR, et al. "Integrative genomic analysis implicates limited peripheral adipose storage capacity in the pathogenesis of human insulin resistance." Nature Genetics. 2017;49(1):17-26. DOI
- Shulman GI. "Ectopic Fat in Insulin Resistance, Dyslipidemia, and Cardiometabolic Disease." New England Journal of Medicine. 2014;371(12):1131-1141. DOI
- Araneta MRG, Kanaya AM, Hsu WC, et al. "Optimum BMI Cut Points to Screen Asian Americans for Type 2 Diabetes." Diabetes Care. 2015;38(5):814-820. PubMed
- Gujral UP, Vittinghoff E, Mongraw-Chaffin M, et al. "Cardiometabolic Abnormalities Among Normal-Weight Persons From Five Racial/Ethnic Groups in the United States (MASALA and MESA)." Annals of Internal Medicine. 2017;166(9):628-636. PubMed
- Ding C, Chan Z, Chooi YC, et al. "Visceral adipose tissue tracks more closely with metabolic dysfunction than intrahepatic triglyceride in lean Asians without diabetes." American Journal of Physiology-Endocrinology and Metabolism. 2018;315(4):E536-E546. PubMed
- Lorenzo C, Wagenknecht LE, Hanley AJG, et al. "A1C Between 5.7 and 6.4% as a Marker for Identifying Pre-Diabetes, Insulin Sensitivity and Secretion, and Cardiovascular Risk Factors: The Insulin Resistance Atherosclerosis Study (IRAS)." Diabetes Care. 2010;33(9):2104-2109. PubMed
- Martin-Rodriguez JL, Gonzalez-Cantero J, Gonzalez-Cantero A, et al. "Diagnostic accuracy of serum alanine aminotransferase as biomarker for nonalcoholic fatty liver disease and insulin resistance in healthy subjects, using 3T MR spectroscopy." Medicine. 2017;96(17):e6770. PubMed
- Holten MK, Zacho M, Gaster M, Juel C, Wojtaszewski JFP, Dela F. "Strength training increases insulin-mediated glucose uptake, GLUT4 content, and insulin signaling in skeletal muscle in patients with type 2 diabetes." Diabetes. 2004;53(2):294-305. PubMed
- Stine JG, Di Joseph K, Pattison Z, et al. "Exercise Training Is Associated With Treatment Response in Liver Fat Content by Magnetic Resonance Imaging Independent of Weight Loss: A Systematic Review and Meta-Analysis." American Journal of Gastroenterology. 2023;118(7):1204-1213. PubMed

Frequently Asked Questions
Common Questions
Deep-Dive Questions
Ready when you are
The chat is our AI assistant, answering from our published guides. To talk it through with Dr. Ash himself, start with the intake.